The figures, area by area
| Area | Jan | Feb | Mar | Apr | May | Jun | Jul | Aug | Sep | Oct | Nov | Dec | Year |
|---|---|---|---|---|---|---|---|---|---|---|---|---|---|
| West Kirby and Hoylake | 33 | 53 | 87 | 116 | 129 | 122 | 120 | 109 | 88 | 60 | 37 | 28 | 980 |
| Moreton, Greasby and Upton | 33 | 53 | 86 | 115 | 127 | 121 | 118 | 107 | 87 | 60 | 38 | 28 | 974 |
| Heswall and the Dee side | 34 | 52 | 86 | 114 | 127 | 120 | 120 | 108 | 87 | 60 | 39 | 29 | 975 |
| Wallasey and New Brighton | 33 | 51 | 86 | 114 | 126 | 119 | 118 | 106 | 86 | 59 | 38 | 28 | 962 |
| Birkenhead and Oxton | 33 | 51 | 85 | 113 | 125 | 119 | 117 | 105 | 86 | 59 | 38 | 29 | 959 |
| Bebington, Bromborough and Eastham | 33 | 52 | 85 | 113 | 126 | 119 | 118 | 107 | 86 | 59 | 39 | 29 | 967 |
PVGIS 5.3, satellite data 2005–2023, 1 kW of panels, 14% losses, one point in each area. Read 3 November 2026.
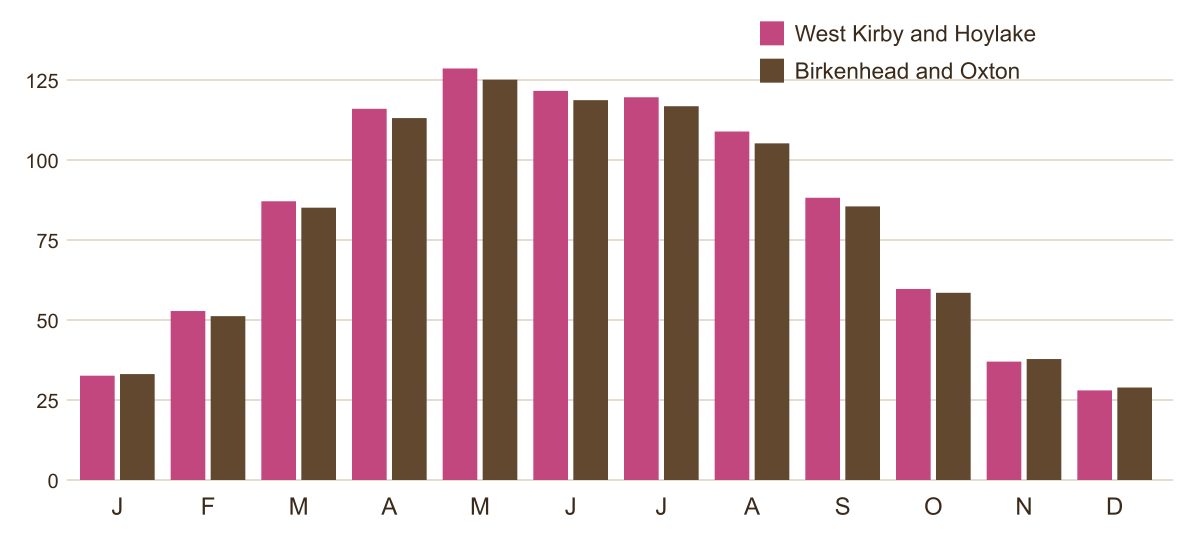
Reading the year
November to January: the lean months
The sun is low, the days are short and the Wirral's winter cloud does the rest. A south roof makes about 28 to 39 kWh per kW in each of these months, so a 4 kW system manages roughly 110 to 155 kWh a month. A typical home, using about 2,500 kWh a year by Ofgem's measure, uses more than that each winter month. Expect to buy most of your electricity from the grid from November to January whatever you do.
February to April: the climb
Output rises by about two thirds from February to March and climbs again into April. By April a 4 kW system makes around 450 kWh, well over a typical household's monthly use. This is when an export tariff starts to matter and when a battery, if you have one, begins to fill most days.
May to August: the surplus
May is usually the best month on the Wirral, a little ahead of June and July: spring skies here are often clearer than midsummer ones. A 4 kW system makes around 420 to 520 kWh in each of these months, about twice what a typical home uses. Most of the surplus goes to the grid unless you use it in the day, store it, or run something like an electric car or a hot water diverter from it.
September and October: the slide
Output falls back towards the winter level, from about 85 kWh per kW in September to under 60 in October. Batteries fill less often; export earnings shrink.
What the swing means for you
- Judge the system on a full year. An installation finished in November will look disappointing until March. Compare your first year's total with the yearly figure for your area, not the first few months.
- Exports are a summer income. Most of what you export, and most export tariff payments, come between April and September. Choose an export tariff with that in mind.
- Batteries do two jobs. In summer a battery stores solar surplus for the evening; in winter, with little surplus, it is more useful charging on a cheap overnight tariff. See adding a battery.
- Winter is about the grid. Solar on its own will not cover winter bills here, so the tariff you buy on still matters.
- Year to year varies too. PVGIS reports a spread of about 30 kWh per kW between typical years at these points: a dull summer can take a few per cent off the total.
Why the west reads higher all year
The gap between the west of the peninsula and the Mersey side shows in almost every month, not just in summer, which points to the cloud pattern rather than the length of the day. PVGIS takes its sunlight figures from satellite images, and over 2005 to 2023 the western side averaged a little more sun reaching the ground. The difference is about 2 to 3% over the year: real, but much smaller than the swing between seasons or the effect of the direction your roof faces. The peninsula map shows it square by square.
Sunshine records
There is no Met Office sunshine station on the Wirral itself. The nearest with 1991–2020 averages is Hawarden Airport, across the Dee in Flintshire, which recorded about 1,570 hours of bright sunshine a year. Solar panels do not need bright sunshine to work, only daylight, which is why the output figures above are a better guide than sunshine hours.
Read next
Sources for this page
- PVGIS 5.3 photovoltaic estimates, European Commission Joint Research Centre
- Ofgem: typical domestic consumption values, decision (May 2026)
- Met Office: Hawarden Airport climate averages 1991–2020
- Ofgem: Smart Export Guarantee
Figures were read at these sources on 3 November 2026. Spotted something out of date? Tell us through the form below.