Peninsula solar map: pick your part of the Wirral
Each square is one point in PVGIS, the European Commission's solar database, for a south-facing roof at 35°. The number is kWh a year for each kW of panels. Choose an area to see its month-by-month output and the coastal questions worth asking.
West Kirby and Hoylake
Faces the open sea: the open sea and the mouth of the Dee.
- South roof at 35°
- 980 kWh per kW a year
- Squares in this area
- 978–983 kWh per kW
- Best tilt facing south
- 41° for about 983 kWh per kW
- A 4 kW system, south at 35°
- 3,920 kWh a year
December gives about 28 kWh per kW and May about 129: most of the year's output comes between April and September.
Questions to ask an installer here
- Ask which salt-mist test the panels passed. IEC 61701 is the standard; its severity 1 is the level meant for sites by the sea. The panel datasheet should say.
- Ask what the rails, clamps and roof hooks are made of. Stainless steel and anodised aluminium cope with salt air; plain steel parts do not.
- Ask for the roof kit's MCS 012 certificate and the wind-uplift figure on it, and how that compares with the wind load worked out for your roof.
- Ask where the inverter and isolators will go. A loft or garage keeps them out of spray.
- Ask how the panels can be cleaned. A salt film and blown sand build up faster on a seafront roof.
Moreton, Greasby and Upton
Sea front and inland streets: the north coast along Leasowe and Moreton; inland streets further south.
- South roof at 35°
- 974 kWh per kW a year
- Squares in this area
- 974–985 kWh per kW
- Best tilt facing south
- 41° for about 977 kWh per kW
- A 4 kW system, south at 35°
- 3,900 kWh a year
December gives about 28 kWh per kW and May about 127: most of the year's output comes between April and September.
Questions to ask an installer here
- If you live within sight of the sea wall at Leasowe or Moreton, use the checks for seafront roofs: salt-mist rated panels (IEC 61701), stainless fixings, and an MCS 012 kit with its wind-uplift figure.
- Further inland (Greasby, Upton, Woodchurch) the usual checks apply: an MCS 012 certified roof kit, a wind-load calculation for your roof, and a sensible inverter position.
- Ask about bird guards if gulls nest on nearby roofs.
Heswall and the Dee side
Faces an estuary: the Dee estuary and its saltmarsh.
- South roof at 35°
- 975 kWh per kW a year
- Squares in this area
- 963–979 kWh per kW
- Best tilt facing south
- 41° for about 978 kWh per kW
- A 4 kW system, south at 35°
- 3,900 kWh a year
December gives about 29 kWh per kW and May about 127: most of the year's output comes between April and September.
Questions to ask an installer here
- Ask which salt-mist test the panels passed (IEC 61701). Estuary air carries less salt than the open coast, but the panels will be up for 25 years or more.
- Ask for the roof kit's MCS 012 certificate and its wind-uplift figure: the Wirral is an exposed peninsula on every side.
- Ask where the inverter and isolators will go, and how cables enter the roof.
- Ask about bird guards if gulls or pigeons nest under panels on nearby roofs.
Wallasey and New Brighton
Faces the open sea: Liverpool Bay and the mouth of the Mersey.
- South roof at 35°
- 962 kWh per kW a year
- Squares in this area
- 962 kWh per kW
- Best tilt facing south
- 41° for about 965 kWh per kW
- A 4 kW system, south at 35°
- 3,850 kWh a year
December gives about 28 kWh per kW and May about 126: most of the year's output comes between April and September.
Questions to ask an installer here
- Ask which salt-mist test the panels passed. IEC 61701 is the standard; its severity 1 is the level meant for sites by the sea. The panel datasheet should say.
- Ask what the rails, clamps and roof hooks are made of. Stainless steel and anodised aluminium cope with salt air; plain steel parts do not.
- Ask for the roof kit's MCS 012 certificate and the wind-uplift figure on it, and how that compares with the wind load worked out for your roof.
- Ask where the inverter and isolators will go. A loft or garage keeps them out of spray.
- Ask how the panels can be cleaned. A salt film and blown sand build up faster on a seafront roof.
Birkenhead and Oxton
Faces an estuary: the Mersey estuary and the docks.
- South roof at 35°
- 959 kWh per kW a year
- Squares in this area
- 959–962 kWh per kW
- Best tilt facing south
- 40° for about 962 kWh per kW
- A 4 kW system, south at 35°
- 3,840 kWh a year
December gives about 29 kWh per kW and May about 125: most of the year's output comes between April and September.
Questions to ask an installer here
- Ask which salt-mist test the panels passed (IEC 61701). Estuary air carries less salt than the open coast, but the panels will be up for 25 years or more.
- Ask for the roof kit's MCS 012 certificate and its wind-uplift figure: the Wirral is an exposed peninsula on every side.
- Ask where the inverter and isolators will go, and how cables enter the roof.
- Ask about bird guards if gulls or pigeons nest under panels on nearby roofs.
Bebington, Bromborough and Eastham
Faces an estuary: the upper Mersey estuary.
- South roof at 35°
- 967 kWh per kW a year
- Squares in this area
- 953–972 kWh per kW
- Best tilt facing south
- 40° for about 970 kWh per kW
- A 4 kW system, south at 35°
- 3,870 kWh a year
December gives about 29 kWh per kW and May about 126: most of the year's output comes between April and September.
Questions to ask an installer here
- Ask which salt-mist test the panels passed (IEC 61701). Estuary air carries less salt than the open coast, but the panels will be up for 25 years or more.
- Ask for the roof kit's MCS 012 certificate and its wind-uplift figure: the Wirral is an exposed peninsula on every side.
- Ask where the inverter and isolators will go, and how cables enter the roof.
- Ask about bird guards if gulls or pigeons nest under panels on nearby roofs.
These are modelled averages for an unshaded roof, not a promise for yours. Trees, chimneys and the house next door matter more than which side of the peninsula you live on. See the full map data and what the output is worth to you.
The six areas side by side
Each area takes its yearly and monthly figures from one PVGIS point inside it, and its range from the map squares whose centres fall on land in that area. The difference between the best and worst areas is about 30 kWh per kW a year, or about 120 kWh for a typical 4 kW system: worth knowing, but much smaller than the effect of shade or a poor roof direction.
| Area | At 35° (kWh/kW/yr) | Map squares | Best tilt | December | June |
|---|---|---|---|---|---|
| West Kirby and Hoylake | 980 | 978–983 | 41° (983) | 28 | 122 |
| Moreton, Greasby and Upton | 974 | 974–985 | 41° (977) | 28 | 121 |
| Heswall and the Dee side | 975 | 963–979 | 41° (978) | 29 | 120 |
| Wallasey and New Brighton | 962 | 962 | 41° (965) | 28 | 119 |
| Birkenhead and Oxton | 959 | 959–962 | 40° (962) | 29 | 119 |
| Bebington, Bromborough and Eastham | 967 | 953–972 | 40° (970) | 29 | 119 |
PVGIS 5.3 (SARAH3 satellite data, 2005–2023), 1 kW of crystalline panels, 14% system losses, terrain shading included. Read 3 November 2026.
Two things stand out. First, the split runs west to east rather than coast to inland: New Brighton sits on the sea but reads about 959, the same as central Birkenhead, because it is on the Mersey side of the cloud pattern, while inland Greasby is the highest point we sampled. Second, the best tilt everywhere is 40 to 41°, a little steeper than most roofs, so the ordinary 35° to 45° pitch of a Victorian or 1930s Wirral roof is already close to ideal.
Roof direction and pitch
Where your house sits on the peninsula moves output by a few per cent. Which way the roof faces moves it by tens of per cent. The table shows the yearly output for every direction and pitch at a mid-peninsula point (Upton and Greasby); for the west add about 1%, for the Birkenhead side take off about 2%.
| Roof faces | 10° | 20° | 30° | 40° | 50° |
|---|---|---|---|---|---|
| South | 878 | 932 | 966 | 977 | 967 |
| South-east | 854 | 887 | 905 | 905 | 887 |
| South-west | 858 | 896 | 917 | 920 | 905 |
| East | 798 | 784 | 766 | 741 | 706 |
| West | 804 | 797 | 783 | 761 | 728 |
| North-east | 741 | 676 | 614 | 557 | 504 |
| North-west | 746 | 685 | 627 | 573 | 519 |
| North | 720 | 636 | 554 | 473 | 397 |
PVGIS 5.3 at 53.384° N, 3.095° W, same settings as above. Read 3 November 2026.
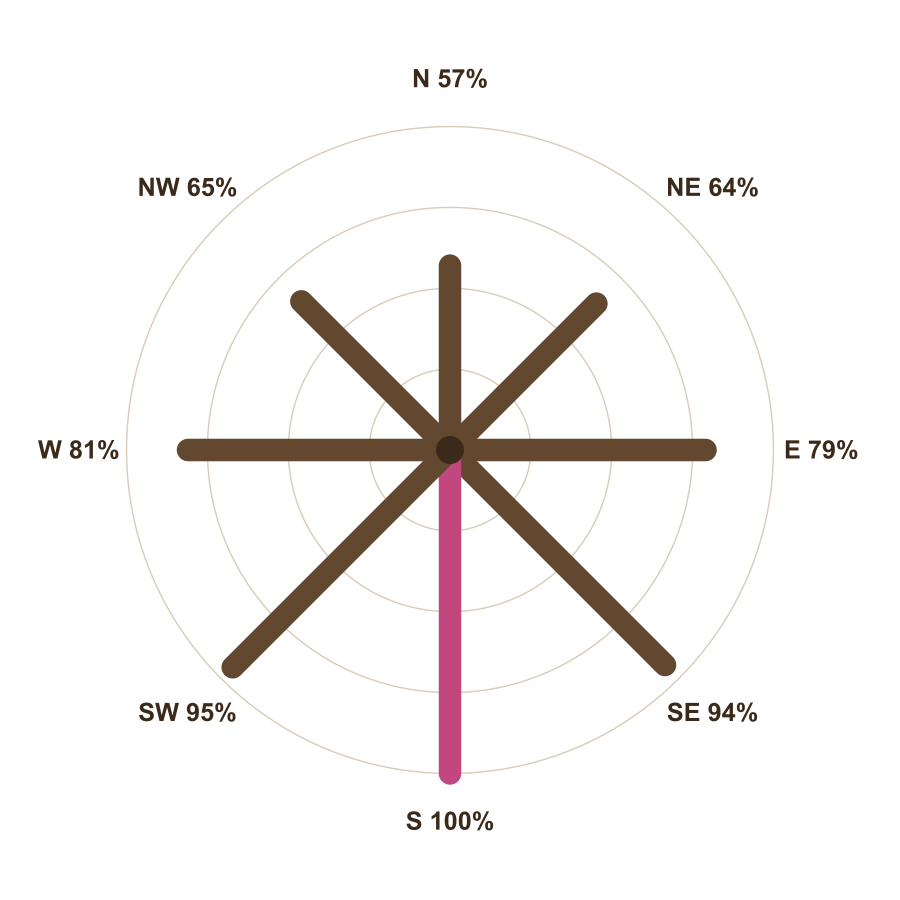
Three practical points follow from the table:
- East–west splits work. Many Wirral semis have a gable roof with one slope facing roughly east and one roughly west. Panels on both slopes make about 80% as much per panel as a south roof, but spread the output over the morning and evening.
- Shallow pitches flatten the differences. At 10°, a south roof gives about 91% of its 30° output and a north roof about three quarters of a south roof at 30°, which is why panels on flat-roofed extensions are usually tilted on frames.
- Steep north slopes are poor. A north roof at 40° or 50° gives under half of a south roof. Most installers will not recommend panels there.
What the numbers mean for a household
Ofgem, the energy regulator, treats 2,500 kWh a year as typical electricity use for a home on a single-rate tariff (its "medium" value from July 2026). A 4 kW south-facing system on the Wirral makes about 3,800 to 3,950 kWh a year, more than that typical use. But the two do not line up in time: the panels make most in summer middays, and a household uses most on winter evenings. In practice a home without a battery uses only part of what its panels make and exports the rest. Is it worth it works through what that split is worth in pounds, with the tariffs stated.
How the map was made
The outline is the Office for National Statistics' boundary for the borough of Wirral (December 2024, generalised to 20 m and clipped to the coastline), published under the Open Government Licence. The squares are a regular grid of points 0.025° apart, about 2.8 km by 1.7 km at this latitude, for each of which we asked PVGIS for the yearly output of 1 kW of panels facing south at 35°. PVGIS is run by the European Commission's Joint Research Centre and draws its sunlight figures from satellite images for 2005 to 2023 and its temperatures from the ERA5 weather record. We used its standard 14% allowance for losses in cables, the inverter and dirt, and its terrain model for shading by hills such as Bidston Hill and the Heswall Dales.
The satellite data comes in cells roughly 3 to 5 km across, so neighbouring squares often share a value, and the boundary between the higher west and lower east is sharper on the map than it is on the ground. Treat each square as the neighbourhood's figure, not your house's. The Met Office's nearest station with a sunshine record, Hawarden Airport across the Dee, averaged 1,572 hours of bright sunshine a year in 1991–2020; there is no sunshine station on the Wirral itself.
What the map cannot tell you
- Shade. A tree, a chimney stack or a taller house to the south can cost more output than the whole west–east difference. An installer should model it from your roof.
- Your roof's real direction and pitch. Few roofs face exactly south. Use the table above with your own compass reading.
- Hot panels. Panels lose a little output in heat. PVGIS allows for it, but not for a roof that traps heat behind the panels.
- Future weather. The figures are averages of past years. In a typical year output lands within about 3% of the average (PVGIS reports a year-to-year spread of about 30 kWh per kW for these points), and a poor summer can fall further.
Read next
Sources for this page
- PVGIS 5.3 photovoltaic estimates, European Commission Joint Research Centre
- ONS Open Geography Portal: local authority district boundaries (December 2024)
- Met Office: Hawarden Airport climate averages 1991–2020
- Ofgem: typical domestic consumption values, decision (May 2026)
Figures were read at these sources on 3 November 2026. Spotted something out of date? Tell us through the form below.